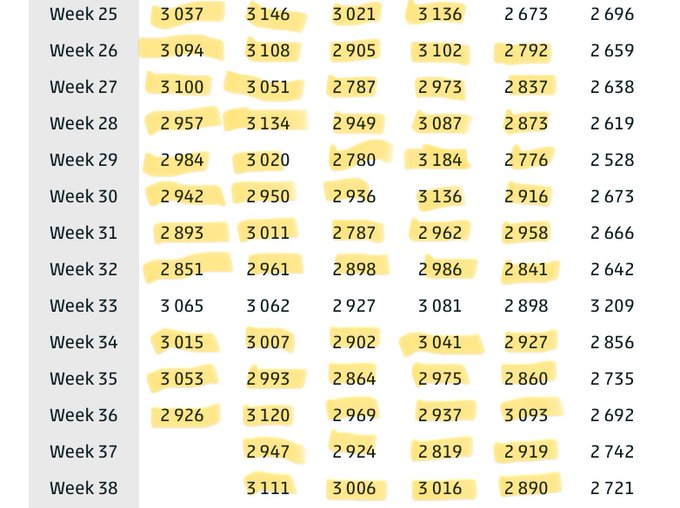
Alle oversterfte hoger dan 2020 van de aflopen 5 jaar geel gekleurd.
Van Linkse kolom 2025 naar rechts uiterst rechtse kolom 2020

Free Spirit welcomes his readers from Austria, Switzerland, Germany, Denmark, Sweden, Norway, United Kingdom, Netherlands, Belgium, Denmark, France, Italy, Spain, Portugal, Africa, Poland, Ukraine, Romania, Macedonia, Bosnia and Herzegovina, Croatia, Greece, Cypern, Australia, Suriname, United States, Canada, Curacao, Russia, India, Taiwan, Hong Kong, Malaysia, China, Japan,
Geen opmerkingen:
Een reactie posten